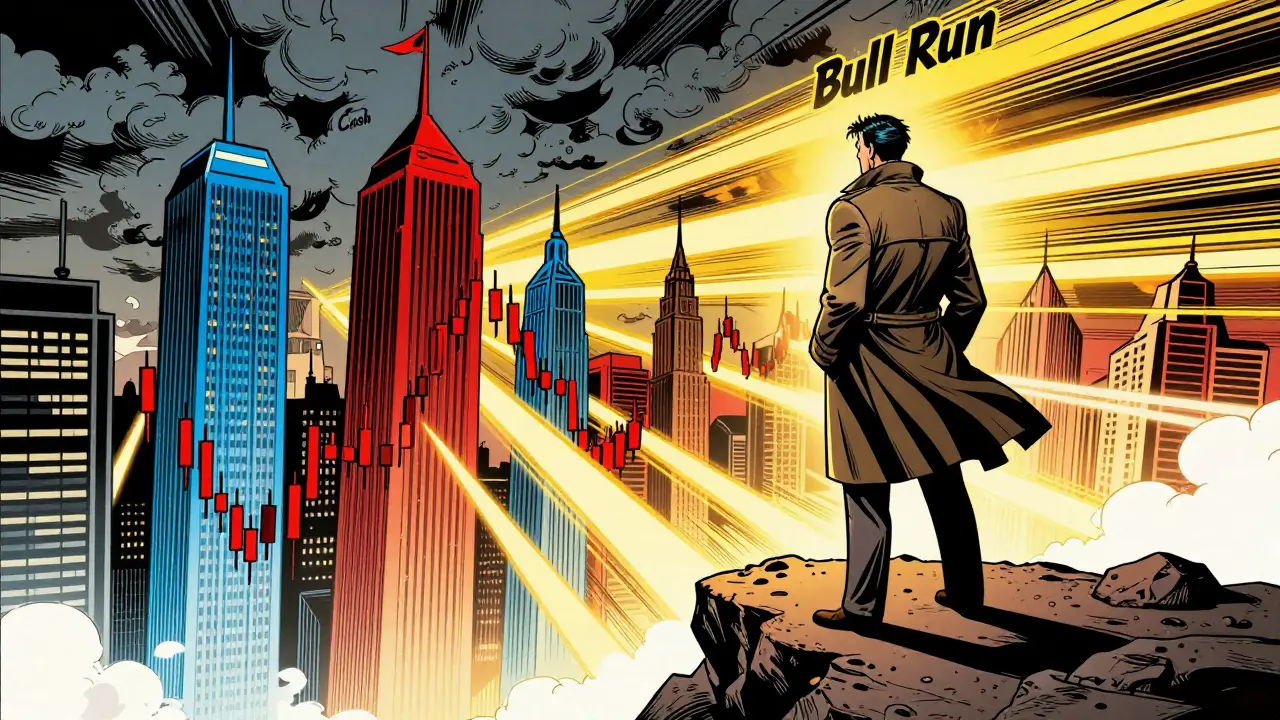
Have you ever watched the price of Bitcoin is a decentralized digital currency that operates on a peer-to-peer network without central authority skyrocket overnight, only to see it crash just as fast a few months later? You are not alone. Since its inception in 2009, Bitcoin has moved in predictable, rhythmic waves known as market cycles. These aren't random spikes; they are structured periods of growth followed by sharp corrections. Understanding these historical patterns is the difference between panic selling at the bottom and taking profits at the top.
We have now witnessed four complete market cycles driven by the Bitcoin Halving is an event that occurs approximately every four years where the reward for mining new blocks is cut in half. The most recent one took place on April 20, 2024. By looking back at the data from 2013, 2017, and 2021, we can strip away the hype and look at the raw mechanics of how these bull runs start, peak, and end. This analysis breaks down what drove each cycle, how much money was made (and lost), and what the current landscape looks like in mid-2026.
The Four-Year Rhythm: Why Cycles Happen
At the heart of every Bitcoin bull run is supply shock. Every 210,000 blocks (roughly four years), the protocol automatically cuts the miner reward in half. This mechanism reduces the rate at which new Bitcoin enters circulation. Historically, when demand stays steady or increases while supply issuance drops, prices rise. It’s basic economics, but in the volatile world of crypto, the reaction is explosive.
Experts like Calen and Brown describe this process using a four-phase model that repeats with eerie consistency:
- Accumulation: Prices trade sideways near the bottom. Volume is low, sentiment is bearish, and most people have given up on Bitcoin. This is where smart money quietly buys.
- Growth: Prices begin to climb toward previous all-time highs. This phase often coincides with the halving event. Exchange reserves start shrinking as holders move coins to cold storage.
- Bubble: Exponential price increases exceed previous highs. Volatility goes through the roof. The Fear & Greed Index hits 'Extreme Greed.' Retail investors rush in, fueled by FOMO (Fear Of Missing Out). Crash: The bubble bursts. Prices typically draw down 78-80% from their peak. Sentiment turns to despair, setting the stage for the next accumulation phase.
Recognizing which phase you are in is crucial. If you buy during the Bubble phase because your taxi driver is telling you about Bitcoin, you are likely buying at the top. If you hold during the Crash because you believe in the long-term thesis, you position yourself for the next Growth phase.
2013: The Wild West Era
The first major bull run occurred in 2013. Back then, Bitcoin was largely unknown to the general public. It was a niche interest for cypherpunks, tech enthusiasts, and early adopters. The catalyst wasn’t institutional adoption-it was distrust in traditional banking. The Cyprus banking crisis served as a wake-up call for many, pushing them to seek alternatives outside the traditional financial system.
| Metric | Value |
|---|---|
| Starting Price (May 2013) | ~$145 |
| Peak Price (Dec 2013) | ~$1,200 |
| Total Gain | 730% |
| Post-Peak Low (2014) | <$300 |
| Market Cap at Peak | $15 Billion |
The gains were massive-a 730% increase-but the infrastructure was fragile. Most trading happened on Mt. Gox, which handled 70% of all transactions. When Mt. Gox collapsed in 2014, it wiped out billions of dollars in value and trust. Users who had turned $1,000 into $8,500 suddenly found themselves with nothing. This cycle taught us a hard lesson: security matters more than price action. Self-custody became a mantra born from this trauma.
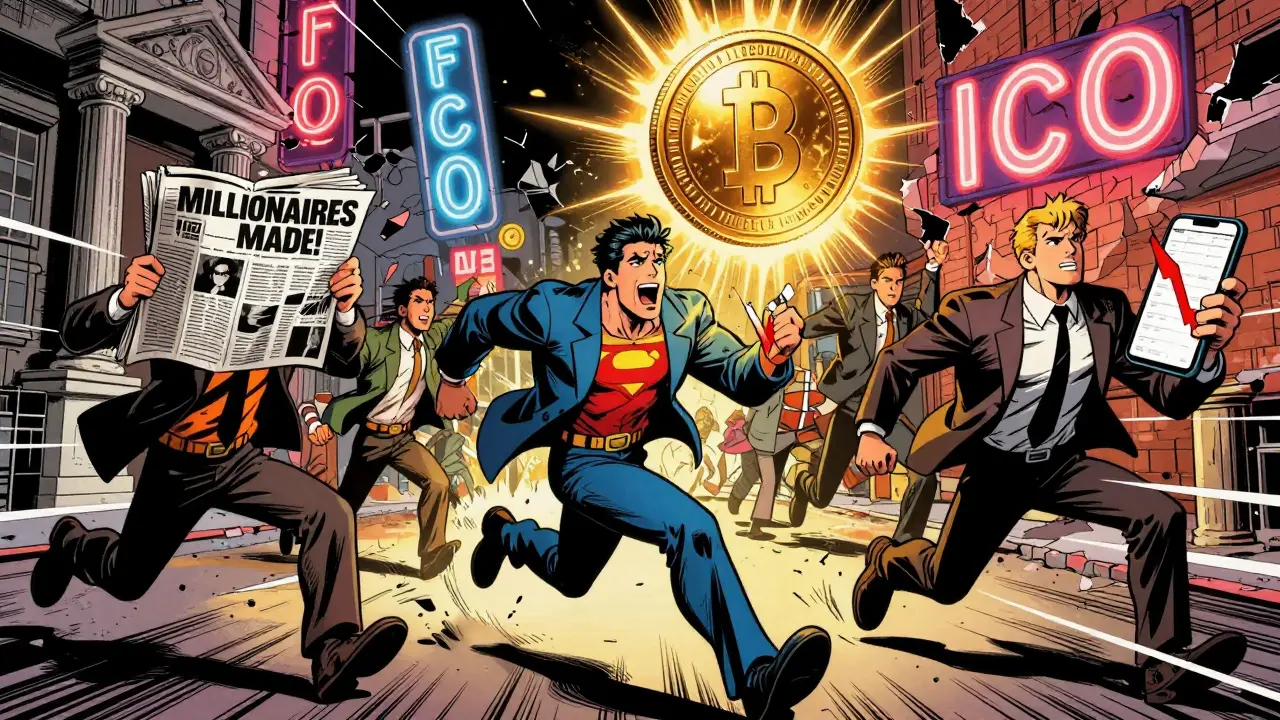
2017: The ICO Boom and Retail Mania
If 2013 was the wild west, 2017 was the gold rush. This cycle was defined by the Initial Coin Offering (ICO) boom. Ethereum’s rise enabled developers to create tokens easily, leading to a frenzy where anyone could launch a project and raise millions. Bitcoin rode this wave, surging from $1,000 in January 2017 to over $20,000 by December.
This was the first time Bitcoin broke into mainstream media. News headlines screamed about millionaires being made. Trading volumes exploded, and platforms like Coinbase struggled to keep up, suffering frequent outages. The total cryptocurrency market capitalization grew from negligible amounts to $560 billion.
However, the euphoria was short-lived. After peaking at $20,000, Bitcoin entered a prolonged bear market, falling below $3,000 in 2018. A 2018 CryptoCompare study noted that 68% of retail traders reported losses during this correction. Many sold at $12,000 thinking it was the top, only to watch it hit $20,000 days later. Emotional trading destroyed more portfolios than bad luck.
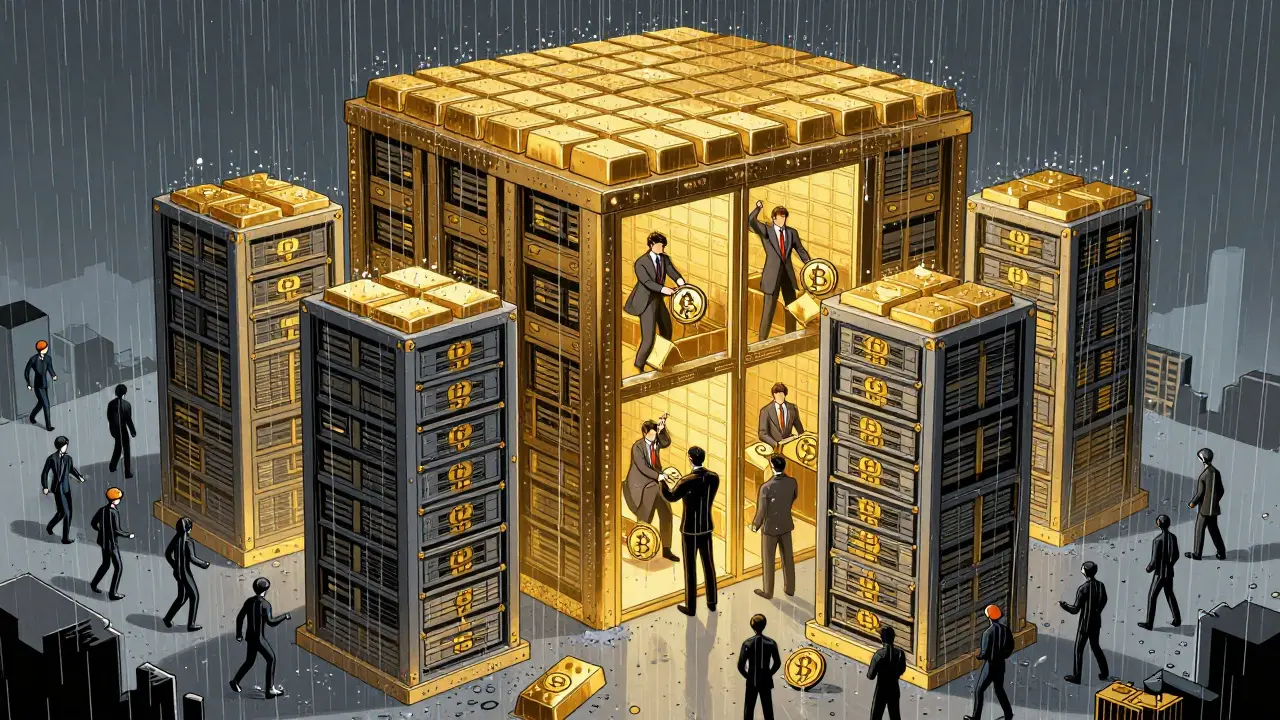
2020-2021: Institutional Adoption Takes Over
The third cycle marked a fundamental shift. It wasn’t just retail investors anymore; big money arrived. Companies like Tesla and MicroStrategy began adding Bitcoin to their balance sheets. This signaled that Bitcoin was no longer just a speculative asset but a legitimate store of value for corporations.
Bitcoin rose from $8,000 to a peak of $69,000 in November 2021. Social volume peaked at 1.2 million mentions per day on Twitter, correlating directly with the price top. The market cap reached $3 trillion. However, the correction was brutal. From November 2021 to November 2022, Bitcoin dropped 77.7%, hitting a low of $15,476. This crash tested the resolve of even the most dedicated holders.
What made this cycle different was the sophistication of the market. Derivatives markets matured, regulatory scrutiny increased, and custody solutions improved. The volatility was still high, but the underlying infrastructure was stronger than in 2013 or 2017.
2024-2025: The ETF Era and Maturing Markets
The current cycle, following the April 20, 2024 halving, is unlike any before. The primary driver is not retail mania or corporate treasury experiments-it’s the approval of spot Bitcoin ETFs in the United States. As of late 2024, these ETFs had accumulated over 850,000 BTC, worth approximately $50 billion. This represents a structural change in demand: institutions can now buy Bitcoin as easily as they buy Apple stock.
By June 2026, we are looking back at a cycle that saw Bitcoin dominance increase to 58% in late 2024, indicating capital rotating from altcoins back to Bitcoin. Analysts at Standard Chartered predicted a peak between Q4 2025 and Q1 2026, potentially reaching $200,000 based on historical percentage gains. Whether that target was met or missed, the key takeaway is the stability brought by regulated custody and institutional-grade trading platforms.
The competitive landscape has also shifted. Bitcoin’s market dominance fluctuated from 94% in 2013 to 40% during the 2017 altcoin season, then back to 55% in 2021. Today, it holds a strong position, supported by daily active addresses increasing from 350,000 in 2013 to 1.8 million in 2021. The user base is larger, more diverse, and more resilient.
Practical Strategies for Navigating Future Cycles
Knowing the history doesn’t guarantee profit, but it helps you avoid common pitfalls. Here are practical steps to manage your exposure:
- Monitor On-Chain Metrics: Watch exchange reserves. When reserves decline, it means holders are moving coins to cold storage, signaling accumulation. Tools like Glassnode provide this data.
- Track the Fear & Greed Index: Extreme fear is often a buying opportunity. Extreme greed is a warning sign to take profits. Don’t let emotions drive your decisions.
- Diversify Your Exit Strategy: Instead of trying to sell at the exact top, use dollar-cost averaging out (DCA out). Sell small percentages as the price rises during the Bubble phase.
- Stay Informed on Regulation: Regulatory developments like the EU’s MiCA regulation impact market sentiment. Keep an eye on policy changes in major markets.
- Secure Your Assets: Learn to use hardware wallets. The lessons from Mt. Gox still apply: if you don’t control your keys, you don’t control your Bitcoin.
Community resources like the Bitcoin Market Cycle Discord server offer real-time analysis, but always verify information. Misinformation spreads quickly during volatile periods. Focus on data, not noise.
Conclusion: The Long Game
Bitcoin’s journey from $0.01 to six figures is unprecedented in financial history. Each cycle has been larger, more complex, and more integrated into the global economy. While past performance doesn’t guarantee future results, the pattern of supply shocks driving demand remains intact. As we move further into the decade, expect less volatility relative to price, but greater integration with traditional finance. The question isn’t whether the next bull run will happen, but how prepared you will be when it does.
How long do Bitcoin bull runs typically last?
Bitcoin bull runs generally follow the four-year halving cycle. The Growth phase often begins around the halving event and lasts 12-18 months. The Bubble phase can last 6-12 months before the Crash phase initiates. For example, the 2017 bull run lasted from January to December, while the 2020-2021 cycle spanned roughly two years.
What causes the post-halving price surge?
The price surge is caused by a supply shock. The halving cuts the new supply of Bitcoin in half. If demand remains constant or increases, the reduced supply drives prices up. Historically, this effect is amplified by increased media attention and retail adoption during the Growth and Bubble phases.
Is the 2024 cycle different from previous ones?
Yes, primarily due to institutional adoption via spot Bitcoin ETFs. Previous cycles were driven by retail speculation or corporate treasuries. The 2024 cycle sees direct inflows from traditional financial products, providing a more stable demand floor and reducing reliance on retail FOMO.
How much do Bitcoin prices typically drop after a bull run?
Historically, Bitcoin experiences drawdowns of 78-80% from peak to trough. For instance, after peaking at $69,000 in 2021, it fell to $15,476 in 2022. This significant correction is part of the natural cycle, clearing out leverage and resetting sentiment for the next accumulation phase.
What indicators signal the start of a bear market?
Key indicators include extreme readings on the Fear & Greed Index ('Extreme Greed'), declining hash rate growth, increasing exchange reserves as panicked sellers deposit coins, and negative momentum in on-chain metrics like active addresses. Additionally, macroeconomic downturns or regulatory crackdowns can accelerate the transition to a bear market.